Memory Snapshots in SAP
Memory Snapshots in SAP
A lot of documentation has been written about memory in the SAP system. During the creation and testing of new developments, questions may arise related to their performance, as well as identifying “vulnerable” spots that could negatively impact the performance of the development.
For these — and many other — cases, SAP provides a tool called Memory Snapshots, which allows developers to analyze a snapshot and uncover all the “juicy” details, and enables consultants to test specific scenarios more thoroughly and efficiently.
How to create a memory snapshot? Option 1.
See: Creating Memory Snapshots
Directly from the ABAP Debugger. This requires you to perform a specific sequence of actions at a particular moment during your program’s execution. The following video clip demonstrates this process.
How to create a memory snapshot? Option 2.
Execute the /hmusa command in the transaction input field.
How to create a memory snapshot? Option 3.
Call the write_memory_consumption_file method of the cl_abap_memory_utilities class in your code.
See: CALL METHOD
What to do with all this?
See: Memory Analysis
See: Memory Inspector
Analyze, compare, and draw conclusions. The appropriate tool for this is available via transaction S_MEMORY_INSPECTOR.
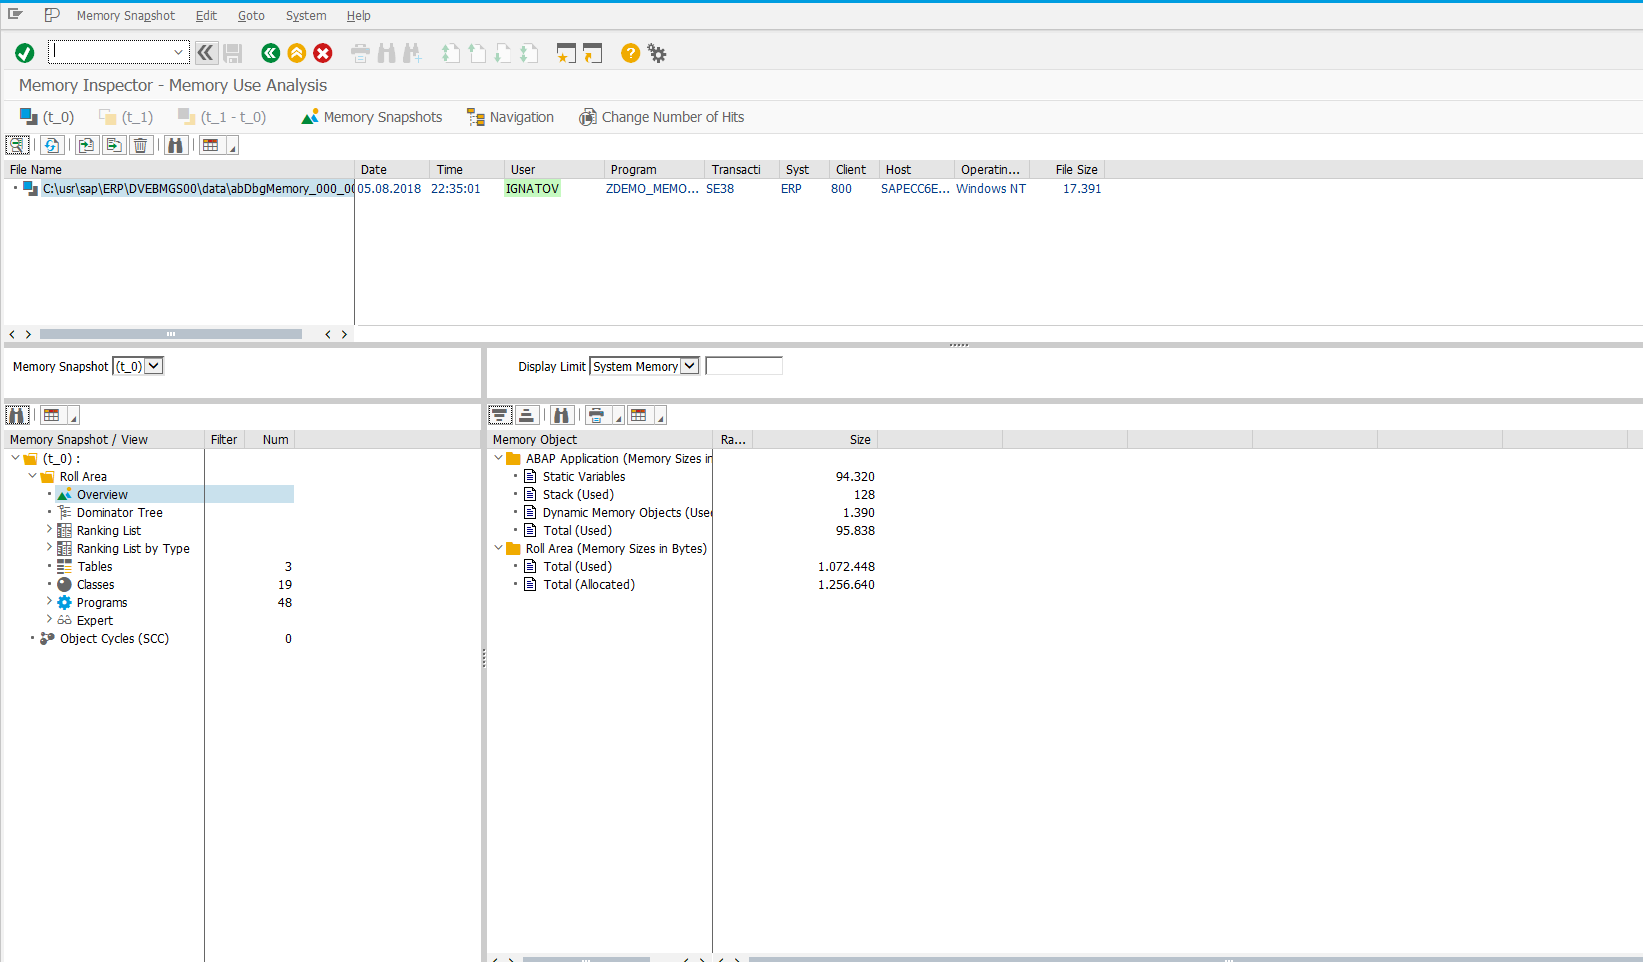
For example:
To decode everything shown in the S_MEMORY_INSPECTOR transaction screen, be sure to refer to the help documentation. Links are provided below:
See: Displaying Memory Snapshots
See: Comparing Memory Snapshots
See: Display Area Functions
The heat does none of us any good — but you are beyond praise! Take care of your “juicy bits.”